NIFTY since 07-Dec-2011 has had a close to 11% fall. Currently the global cues are positive after an impressive Housing data from US. So its neither genius of mine nor an insight to say that morrow we may have a Gap up opening to the tune of 60-80 points or probably even higher. Lets take a look at the Charts to see if there is more room for the rally to continue.
Hourly Chart of NIFTY
Observations:
- The above is the fibonacci retracement level of NIFTY on Hourly Charts. In a downtrend usually a security can retracement 50-61.8% of retracement. Going by that theory we can expect NIFTY to hit 4816-4883 levels.
- During this move possible roadblocks would be faced at 4610 - 4665 - 4760 - 4806 - 4875 levels.
- One assumption above is that 4532 (Today's Low) should not be breached.
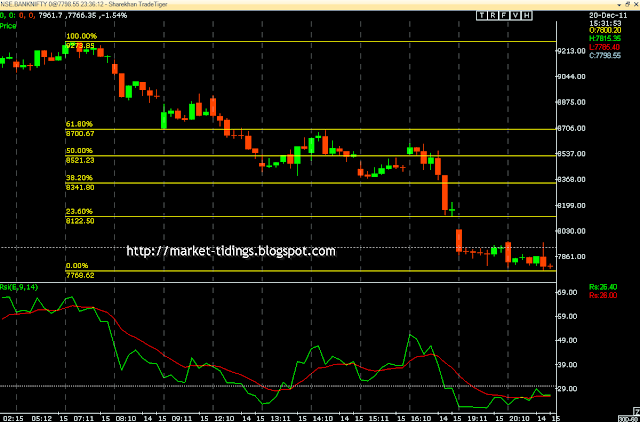
Hourly Charts of BANK NIFTY
Observations:
- The above is the fibonacci retracement level of BANK NIFTY on Hourly Charts. In a downtrend usually a security can retracement 50-61.8% of retracement. But the kind of hammering the Bank NIFTY has taken it can max retrace upto 38.2%-50%.
- Going by that theory we can expect BANK NIFTY to hit 8300-8500 levels if 7700 levels is held. 7700-7800 is a key support on Monthly Charts as well.
Bottom Line: High Beta names like Private Sector Banks, Metals & Mining Counters & Infra Counters can see sharp rally.
NIFTY Levels - If 4532 is not breached on lower side can rally up to 4816-4880.
BANK NIFTY Levels - if 7700 is not breached on lower side can rally up to 8300-8500 levels.
Stop Loss: A Stop Loss of Today's Low is must on any Longs that are initiated.
Market Wisdom: Rallies in Bear Markets would be lesser in time frame & vicious.


No comments:
Post a Comment