Saturday, December 31, 2011

Markets in 2012

2012 - Make or Break Year for Indian Economy


Recap 2011: 2011 has ended & it would be remembered in India for mainly these - Corruption, High Inflation, Depreciating Rupee.

To elaborate on the above 3 main points - Corruption cases against key ministers put Government on a back foot which meant that key reforms or the bills were tough to be passed. Government attempted to bring in FDI but was strongly opposed. There were no significant orders for Power or Infrastructure companies. Credit growth slowed. Policy paralysis meant that FII's started losing confidence in India's Growth Story - They started pulling money out of the markets - This lead to Currency Depreciation - Indian Rupee depreciation also made matters worse for FII's, as DEFTY (Benchmark Index NIFTY in Dollar Terms) is down by more than 35% compared to NIFTY that is down by 25%. 
On the other end the Central Bank (RBI - Reserve Bank of India) was busy tackling inflation. It made it very clear that bringing down Inflation is their first priority (Even at the cost of Growth getting affected). What followed this hawkish stance was a series of 7 hikes in interest rates in 2011 (2010 had seen series of 6 hikes). This meant that Growth had to take toll. the recent October month IIP data (Index of Industrial Production) saw a degrowth to the tune of 1.9% (Chief destructor in the Index was Capital Goods sector that saw a degrowth of 25% - Partly because of very high base figure & major part due to lack of any industrial activity).

Where do we stand as of now:
  • Inflation is coming under control & by March'12 it would be around 7%. Food Inflation is around 6 years low (Partly because of higher base of last year).
  • Central Bank has indicated that the focus now is on bringing Growth back in the economy after Inflation is coming under control. It expressed a Dovish stance wrt to Interest rates & the cut in rates may come some time in Q4 FY12E or Q1FY13E.
  • Higher interest rates has taken a toll on Rate Sensitive sectors & this has meant lower Gross profit for these companies resulting in lesser tax payments - Leading to lesser Revenue collection by Government.
  • Policy Paralysis also has meant Currency Depreciation - In turn has taken toll on lot of Companies'
  • For government its been a really tough year as the revenues are down & GDP is under pressure (Q2's GDP was sub 7% first seen since June'09). Due to non-conducive environment to divest their stake its turning to the route to raise more debts - This means more pressure on the Long Term Yield. Government as per recently announced schedule is expected to raise roughly 1.5 Lakh crores in Treasury Bills in the current quarter. Government's move to raise such huge money in the last quarter is an indication of how cash crunch the government is & how bad the Fiscal & Current Account Defict Numbers can be for the current financial year. Estimates suggest that Fiscal Deficit can be as high as 5.5-6% of GDP & Current Account Deficit to the tune of 3.5% to 4% of GDP.
  • In a way 2012 can well be a make or break year for Indian Economy at least in terms of attracting foreign capital. Currently India has least weightage among BRIC nations in Portfolios managed by Foreign fund managers. Corruption & Policy Paralysis are the main reasons for them to keep low weightage. India has taken first step towards attracting foreign capital by allowing Qualified Foreign Investors (QFI) to invest in Indian stocks directly. Their investments would be limited to 10% to Paid up capital of the company. Also no single QFI can hold more than 5% of Paid up capital in any Company.
  • Its been 10 years since the term BRIC (Brazil, Russia, India, China) was coined by Goldman Sachs Chief Jim O'Neill. Indonesia is doing good in terms of Policy reforms and that might attract capital going forward. So the writing is on the walls in terms of FIIs flow. I in BRIC may remain but India may well be replaced by Indonesia if policy paralysis continues!
NIFTY Monthly Chart
Long term excellent buying Opportunity in NIFTY would be around 4300-4200 all the way to 4000-3800 levels (If we manage to get there). Best thing to do would be start investing part of capital from 4400 level on wards during every declines. This is easier said than done as Mind would say to wait it out to buy at the extreme bottom. By now one should know its extremely difficult to catch a top or a bottom. So buying around the bottom (+5%) should be a feasible approach. So one should make up his/her mind with the levels & buy quality stocks around those levels in a disciplined manner.


Bottom Line: I am sticking my neck out to say that the range for the year in NIFTY in 
Good Case Range Would be 4200-5700. Bad Case Range would be 3800-5400.

Themes for 2012
  • Bullion: Sell Gold, Buy Silver.
  • Currency: The new floor for USDINR may well be 50 & range can be 50-55 for the entire year.
  • Bonds & Equities: Buy Dynamic Bond Mutual Funds & Good Quality Equity Diversified/Multi Cap Funds. Balanced Funds would give good returns with Interest rates set to fall & in later half equities expected to fair well.
  • Second Half of 2012 (July-Dec) to be better than the first half of 2012 (Jan-Jun).
Wishing you all a Healthy, Wealthy & a Prosperous 2012

Sunday, December 25, 2011

NIFTY Outlook for the Week 26Dec-30Dec 2011

1. Week gone by at a Glance

NIFTY started the week flat by opening at 4623, managed to go down to 4531 but managed a quick recovery & ended the week with marginal gains of 1.6% by closing at 4714.
As per this post (NIFTY Down Moves), each of the previous down moves were of the range of 13-17%. The current sell-off from 5099 can be said to have ended at 4531 levels. Mind you on weekly charts we are yet to see a bottom formation (Has been witnessed on daily charts). So if this week we manage to stay above the lows then only weekly too we would have a intermediate bottom in place for the upmove that can take us to 4850-4900 levels.
Sell-Off 1: 6181 to 5177 (16.23%)
Sell-Off 2: 5700 to 4720 (17.19%)
Sell-Off 3: 5350 to 4639 (13.28%)
Sell-Off 4: 5099 to 4531 (11.13%)

2. Charts
2.1 Weekly Charts
Much awaited pullback was seen in NIFTY. With FII's not that much active the Index managed a smart pullback of 5% from the lows. Going forward as long as NIFTY remains above 4640 on closing basis the trades on Long side would be profitable till atleast we are near 4806-4850. Below 4640 the bears would become active and chances of new lows can be seen.
Indicators: Positive Divergence is seen in MACD. Slow Stochastic is oversold & RSI is still below 50 indicating the lack of buying in the ongoing trend.


2.2 Daily Charts
NIFTY from Tuesday is moving in a steep upward trendline & sooner rather than later will fall from the trendline & can reach its important support of 4640. If this level is held on to then an upmove to 4850 can be seen.
Indicators: RSI & William's % R are indicating weakness & monday most likely we may hit 4640 levels.

2.3 Volume Weighted Charts


3. Derivatives
3.1 OI Chart

Highest Concentration of Puts is at 4500 Strike with a OI of 73 Lakhs (Previous Week was at 63 Lakhs). 4600 Strike is next with a OI of 67 Lakhs.
Highest Concentration of Calls is at 5100 Strike with a OI of 78 Lakhs (Previous Week was at the same level). 4900 Strike is next with 71 Lakhs in OI.
Total Calls OI in the Near Month is 5.93 Crores. Total Puts OI in the Near Month is 5.13 Crores.
Put Call Ratio is still below 1 indicating aggressive call writers haVe still not squared up their shorts.

4. Bottom Line
  • Last Trading Week of the Calendar Year 2011. Expect market to trade with positive bias with good support coming in from MF's buying to dress up the NAV for Quarter End.
  • The December Month's Closing is very important for the Yearly, Quarterly, Monthly charts. On Monthly Charts, This month the opening tick was at 4970 levels. On Quarterly the Opening was at 4874 levels. The more we get close to 4874 levels the formation would look like a "Inverted Cross".
  • Sectors to Watch out for: Telecom Sector is looking weak. IT is mixed with TCS showing strength & INFY showing weakness. Banking & Auto space may see continued pull backs.
  • Trading Strategy - One can keep their Long positions open as long as Index manages to stay above 4640. Stiff resistance would be faced at 4760-4810-4860-4880 levels. Strong supports exist at 4700-4640-4550.
  • Max Pain Theory for Options suggest that Expiry may happen around 4800 levels.

Wednesday, December 21, 2011

NIFTY & BANK NIFTY Trading Levels

NIFTY since 07-Dec-2011 has had a close to 11% fall. Currently the global cues are positive after an impressive Housing data from US. So its neither genius of mine nor an insight to say that morrow we may have a Gap up opening to the tune of 60-80 points or probably even higher. Lets take a look at the Charts to see if there is more room for the rally to continue.
Hourly Chart of NIFTY

Observations:
  • The above is the fibonacci retracement level of NIFTY on Hourly Charts. In a downtrend usually a security can retracement 50-61.8% of retracement. Going by that theory we can expect NIFTY to hit 4816-4883 levels. 
  • During this move possible roadblocks would be faced at 4610 - 4665 - 4760 - 4806 - 4875 levels.
  • One assumption above is that 4532 (Today's Low) should not be breached.
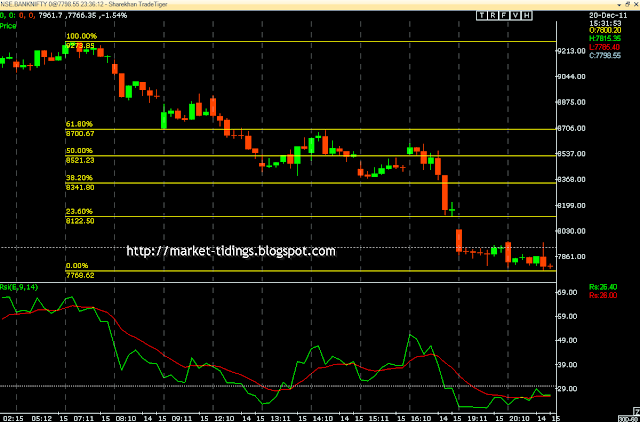
Hourly Charts of BANK NIFTY


Observations:
  • The above is the fibonacci retracement level of BANK NIFTY on Hourly Charts. In a downtrend usually a security can retracement 50-61.8% of retracement. But the kind of hammering the Bank NIFTY has taken it can max retrace upto 38.2%-50%. 
  • Going by that theory we can expect BANK NIFTY to hit 8300-8500 levels if 7700 levels is held. 7700-7800 is a key support on Monthly Charts as well.
Bottom Line: High Beta names like Private Sector Banks, Metals & Mining Counters & Infra Counters can see sharp rally. 

NIFTY Levels - If 4532 is not breached on lower side can rally up to 4816-4880.
BANK NIFTY Levels - if 7700 is not breached on lower side can rally up to 8300-8500 levels. 

Stop Loss: A Stop Loss of Today's Low is must on any Longs that are initiated.

Market Wisdom: Rallies in Bear Markets would be lesser in time frame & vicious.

Monday, December 19, 2011

NIFTY - Darkest Before Dawn

Million Dollar Question from anyone right now is where can NIFTY stop & reverse. As all of you would be aware of the phrase "Don't Catch a Falling Knife" - Best time to buy would be when there is a reversal. Meaning the current period's candle starts trading above previous period's candle.


Lets quickly take a look at NIFTY's Monthly Charts. 
Observations:
  • The NIFTY has 2 trendlines intersecting at around 4450 levels. One of them is the Descending Channel's Bottom-Bottom Trendline & the other is the Rising Trendline (Lows of October'08-March'09).
  • The second chart is on Fibonacci levels drawn from the lows of 2261 to highs of 6338. 50% retracement level comes in at 4292. 61.8% retracement is at 4778. So the new range for the index may well be 4300-4800 going forward for few months now. 

NIFTY Monthly Charts


NIFTY Monthly Fibonacci Charts


Bottom Line: First thing would be for the Index to form a base the more time it spends forming that base the more stronger the next bull run would be. So even an six months to one year of trading in a tight range may well become a blessing in disguise. Last time this accumulation too took place for six months from Nov'2008 to March'2009 (5 months) before finally moving up decisively. 

Remember this - It's always Darkest Before Dawn.

Saturday, December 17, 2011

NIFTY Outlook for the Week 19Dec-23Dec 2011


Finally a close below 4700!


1. Week gone by at a Glance
  • Bears went on rampage during the penultimate hour of trade on Friday, what followed was a swift Basket Selling across counters & Index fell from the Highs of 4800 on Friday to the lows of 4629. However last half an hour saw swift buying (Probably by DII's) that took the index above 4650.
  • NIFTY has closed first time below 4700 in 25 months & is at 2-Year Lows.


1.1 Events Highlights
  • RBI kept the key rates unchanged. Repo Rates at 8.5%, Reverse Repo Rates at 7.5% & Cash Reserve Ratio at 6%. Much awaited CRR cut was not required as RBI is actively conducting OMO (Open Market Operations) as and when there is liquidity crunch. More importantly RBI indicated that the focus has shifted towards revival of growth as more or less Inflation is coming under control. To add to this RBI stated that further rate hikes may not be warranted but there is uncertainty on when the rate cycle would reverse. Bottom line to take from this is Interest Rates have peaked out & Stance has shifted to revival of Growth from Stemming of Inflation. Actual cut of Interest rates may take place sometime in Q4'FY12E.
  • Index of Industrial Production also known as IIP were dismal to say the least. October Month's India's Industrial Production numbers came in at -5.1% with capital goods sector leading the degrowth -25% YoY (Yes no typos here). This is the first time since June'09 we saw a degrowth in IIP.

1.2 Currency Depreciation
At the helm of things the currency depreciation is the single most worrisome factor for the Indian economy right now. Indian Economy is not able to take advantage of Fall in  Commodity prices due to Rupee depreciation. The chart beside shows that Indian rupee is the worst performing currency against the US Dollar in Asia year to date.


1.3 Index Highlights & Sectoral Performance
One of those weeks where all Equity Indices of the world & commodities corrected significantly. Even Precious metals like Gold, Silver were down. Bears were rampant in all the Asset Classes :-) . All Sectors were down except for FMCG.


2. NIFTY Charts
2.1 Weekly Charts
On Weekly Charts, The bearishness continues the only Positive being the Slow Stochastic is still not making new lows whereas the Index is making lows. So a bounce can be expected. 

2.2 Fibonacci Timewise Analysis
The below is a Long Term Weekly Chart of NIFTY from 2006. There are multiple times when the index has spent around 4650-4700 levels. For the short term a meaningful pull back to at least 4824-4850 cant be ruled out if 4550-4590 is protected by the Bulls on closing basis. 
As pointed out in Charts,
Monthwise - Dec'11 is the 13th month from the Top that was made in Nov'10. As per Fibonacci Time series theory used in markets the Tops/Bottoms made during the fibonacci period would most probably remain intact till the next such Fibonacci Numbered period. This would imply the next Fibonacci month would be 21 i.e July'12. So by applying this theory, the bottom made during this month should hold good till July'2012
Weekwise - We are well past the 55th Week, so next is 89th Week from the Top, which falls in July'12. So in all probability July'12 can well see the culmination of the Bear Market!. What would it mean in near term is - The Bottom formed in December'2011 should in all probability remain an Intermediate Bottom till at least July'2012. At this juncture it is very unlikely that December'11 bottom not being able to break. All analysts are bearish & everyone coming up with the view that Index may head to 4400-4200 & some even speaking of 3600 levels. This reminds of 2008 Bear Market - Where everyone was calling for Sensex to fall to 6000 when Sensex was hovering around 8,000-10,000. What index did later is there to see for everyone. Emphasis here is One can't catch a top or a bottom. So from current levels one can slowly start nibbling in into quality beaten down stocks or even buy good mutual funds & keep adding it on the way down.
(Please take this Fibonacci Time Series Analysis with a pinch of Salt as am still learning this).

2.3 Daily Charts
NIFTY had briefly come out of the Lower Top Lower Bottom Formation. But after making a Lower Top of 5099 on 07-Dec-2011 its on its way to make a lower bottom indicating Downtrend in the near term. 


2.4 Hourly Charts
On Hourly charts too NIFTY is making Lower Highs & Lower Lows. Only Positive is Hourly RSI is showing Positive Divergence.


2.5 Volume Profile Charts


3. Derivatives
3.1 Options Data - OI
Highest Concentration of Puts is at 4700 Strike with a OI of 70 Lakhs (Previous Week was at 82 Lakhs). 4500 Strike is next with a OI of 63 Lakhs.
Highest Concentration of Calls is at 5100 Strike with a OI of 78 Lakhs (Previous Week was at the same level). 5000 Strike is next with 66 Lakhs in OI.
Total Calls OI in the Near Month is 5.92 Crores. Total Puts OI in the Near Month is 5.27 Crores.
Put Call Ratio has fallen below 1 indicating aggressive call writing done.


4. Events
22-Dec-2011 : India's Weekly Food Inflation Numbers for the week ending 10-Dec-2011.
22-Dec-2011 : US & UK Q3 GDP Numbers.


5. Bottom Line
  • The trend in Weekly, Daily, Hourly timeframe continues to be down. Indicators are oversold & RSI, MACD & Slow Stochastics is exhibiting Positive divergence in Hourly & Daily  time frames
  • Any pullback rally can face serious resistance at 4760-4806-4824 levels. Strong support comes in at 4590. 
  • Please keep in mind that markets are forward looking by 1-2 quarters always. So if Index is making new 2 year lows now would mean that the FY'12 Annual results & Q1 FY'13 earnings growth may well be significantly lower.for majority of companies.

Market Wisdom: In a Strong Downtrend "Supports are broken Mercilessly" & in Strong Uptrend "Resistances are taken out with utter disdain".

Sunday, December 11, 2011

Bharti Airtel - Will The Support Level Hold?

Shares of Bharti Airtel, India's Number 1 Telecom Company closed at a lower level of 358.70 down 8.5% W-o-W (Week-on-Week). The TRAI's proposal to remove roaming charges for consumers and the 2G Scam inquiries seems to be couple of reasons for weakness in the stock.


Charts
1.1 Weekly Charts
Bharti Airtel for the past 24 months is moving in a Rising Trend Channel (Channel Width of 120 points). Currently on the Weekly charts the Stock Price stands at the bottom trendline with a crucial support level of 350-355. 
Indicators: RSI has gone below Signal line & heading downwards (Signalling strong selling pressure.
1.2 Daily Charts
Triangle breakdown seen on charts. Also in the current week the stock has moved below 50-Day & 200-Day EMA.
1.3 Hourly Charts
Stock is in a Falling Trend Channel since 5-Dec-2011. 355 would be the level to watch on monday. If held then can rally till 370 (Stiff resistance would be faced at this level followed by 385 levels (200 Hour EMA). Till the Trend channel is not breached the weakness would drag the stock further down.
Indicators: MACD is in Sell Mode (below Zero line). RSI & William's %R have come out of the oversold levels.
1.4 Volume Profile Charts
Volume Profile charts indicates the Volumes at each price level. If Price is above the High volume level then it would act as a Support & if Price is below the High volume level then it would act as a Resistance. 
In the current case of Bharti Airtel, the High volume levels come around 378-387. Price is at 356. So the supply zone would be around 378-387 if in turn we bounce from the current levels.

Two scenarios can play out here.
Scenario - A: A closing below 355 levels would open up the gate for 343 (200 Week EMA), below this level it can move swiftly to 315-310 levels.
Scenario - B: Demand comes in around 350-355 levels & stock rallies to 380-390 levels.
pressure)
Bottom Line: Stocks tend to bounce from their critical supports when its moving in a Trend channel but in the current grim scenario in the markets & the way the charts are positioned  "Probability of Scenario-A seems more likely than Scenario-B".

NIFTY Outlook for the Week 12Dec-16Dec 2011

1. Week gone by at a Glance

  • S&P CNX NIFTY for the Week closed down by 3.63%. DEFTY (Dollar Denominated NIFTY) closed the week with 5.5% in negative territory. 
  • Exchange Rate USDINR closed above 52 Rs. mark again. 
  • GDP Growth Outlook has been lowered to 7.5% (+ or - 0.25%). Lowest in four years.
  • FM says Fiscal Deficit Target of 4.5% of GDP would not be met & expectations are there may be slippage to the tune of atleast 10% if not more.
  • FDI in multibrand retail has been put on hold after strong opposition from Opposition parties & even allies of UPA.
  • EU summit was a partial success, that EU leaders at a time when they are pushed to the wall agreed on new rules for budget discipline.  UK has stayed out after France & Germany did not agree on the concessions that UK asked. So UK along with Hungary are staying out. Czech Rebuplic & Sweeden are still unclear whether to join in or not.
1.1 Performance of Index with Global Peers
India was the second worst performing market after Russia among Emerging Markets.
1.2 Sectoral Performance
All sectoral Indices closed down in Red with exception of IT (which clocked gains of 0.1%).
2. NIFTY Charts
2.1 Weekly Charts
NIFTY faced resistance at the 20 Week EMA of 5100 levels & from there headed downwards to find support at the all crucial level of 200 Week EMA of 4855. Any close below 4850 levels can take us again to the lower levels of 4700-4650.
Indicators: All indicators are indicating bearishness. Slow Stochastic has arrested the fall  & become neutral but is still not looking bullish.
2.2 Daily Charts
NIFTY for the first 2 days of the week was positive but as was pointed in last weeks blog post that volatility can be seen in the latter part of the week. The same thing happened & in last couple of days it sold off close to 250 points (5%). 
Indicators: RSI is below 50 & heading further down, MACD is in Sell Mode by going below 0 line. Slow Stochastic turning to sell mode after reaching overbought levels. NIFTY is below 20,50,200 EMA (Extreme bearishness). Below 4850 we are staring at 4700-4650 levels. Any upmove would be faced with strong resistance at 4960 levels.
2.3 NIFTY Hourly Charts
On Hourly Charts once NIFTY opened gap down it broke the Trendline & so any further upmove would face resistance at the Trendline & also the 200 Hour EMA is at 4960 levels.
Indicators: All Indicators(William's %R, Slow Stochastics) are in oversold region & a bounce to 4950-4960 can't be ruled out. MACD below zero indicating further bearishness
2.4 NIFTY Volume Profile Charts
NIFTY Volume Profile charts shows  Support at 4806 levels & Resistance at 4960 levels.

3. Derivatives
3.1 Options Data - OI
Highest Concentration of Puts is at 4700 Strike with a OI of 82 Lakhs (Previous Week was at 80 Lakhs). 4800 Strike has second highest OI at 59 Lakhs.
Highest Concentration of Calls is at 5100 Strike with a OI of 78 Lakhs (Previous Week was at 50 Lakhs). 5000 & 5200 Strikes too have roughly 60 Lakhs in OI.
Implication: Calls at 5100 levels have been aggressively written (Increase of 50% Week on Week) as Call Writers are confident that 5100 would be tough to break after market started to retreat from those levels. Interesting to note is the OI of 4700 Strike Put has not seen any fresh unwind indicating that Put Writers are confident that 4700 would hold. But any breach of this range of 4700-5100 can bring in a swift move either side.
4. Events & News Makers
4.1 Events
This week Domestically would be an action packed week in terms of the events that are lined up.
  • 12-Dec-2011 - IIP Numbers (Estimates are it would be lowest in more than 2.5 years)
  • 14-Dec-2011 - Monthly WPI Numbers (Estimates are it would be lower compared to previous month)
  • 15-Dec-2011 - Advance Tax Numbers for Q3 (Sectors to watch out for is Auto - due to encouraging sales numbers & FMCG - Strong Rural Demand, Banking as a sector may disappoint with low credit growth & hence lower taxation.
  • 16-Dec-2011 - Mid Quarter Monetary Review by RBI (Expectations are of atleast 25bps cut in CRR)
  • Globally, on 13-Dec-2011 US - FOMC Rates decision. 
4.2 News Makers
  • The news flow on Telecom 2G spectrum scam is not going too well with the Telecom stocks. Bharti Airtel & Idea lost 8.9% & 10.9% respectively in this week & are looking weak. Bharti has strong support at 354 & Idea has strong support at 85. Any close below these levels can take stocks down by another 5 to 10% atleast.
  • The confidence on the Government is at all time low & there are pressures that are building up from Opposition as well as common public (angered with high inflation & corruption in the system). UPA has its back to the walls. It's now or never for them & would be interesting to watch the Policy action from the government. They tried to bring in FDI but was met with fierce opposition. Lets wait what tricks they have in their bag. Have a feeling that Government may take up some policy action soon & create a better environment for Divestment of PSU's.
5. Bottom Line
  • With so many economy related events due in this week, the movement of the NIFTY would be dictated by these numbers.
  • On Daily, Weekly Time Frame there is still weakness & indicates that NIFTY can move downwards. On Hourly NIFTY is oversold & can expect a bounce to the magnitude of 50-80 points.
  • Strong resistance at 4960 levels & Strong support at 4806 levels. So these two levels would act as Trend deciding factors.

NIFTY Supports & Resistances 4700 <- 4750 <- 4800 <- 4850 <- 4863 -> 4960 -> 5050 -> 5100 -> 5169

Saturday, December 3, 2011

NIFTY Outlook 05Dec2011-09Dec2011

Bulls made a dramatic comeback in this week with NIFTY clocking gains of over 7%.


1. NIFTY Compared to other Markets
  • NIFTY was the second best performing market index among the Emerging markets. There were no surprises with the Q2 GDP Numbers which came as per estimates at 6.9%. Food Inflation at 8% was a pleasant surprise (4 month low).
  • The main reason for such mad move across the global markets has to be attributed to the coordinated actions taken up by the central banks (To provide cheaper Dollar Funding) of major nations to enhance their capacity to provide  liquidity support to the Global Financial System. There were rumors that a major European bank was at a brink of default & hence such action had to be taken quickly by Central Banks. 
  • With such liquidity infusion Dollar is made freely available & hence Dollar Index corrected 1.3%, (I was expecting Dollar Index to move past 80, but this coordinated action has made Dollar Index form a Double top intermediate term), this is good news for Equity Markets. 


2. NIFTY Charts
2.1 Weekly Charts
After breaking down from the Descending Triangle Pattern couple of weeks back. NIFTY managed a smart rally. NIFTY so far has closed only couple of times below 200 Week EMA. Every time its bouncing off this level the relief rally has been good.
Indicators - Weekly RSI is approaching crucial resistance zone of 50-52, Slow Stochastics is still in Sell Mode (Moving southwards), MACD & Signal Line are on top of each other (No clear sign of further rally).

2.2 Daily Charts 
NIFTY in the week created an Up Gap (Gap area of 4852-4917 [65 Points]). This gap area should provide good support going forward. Resistance would be faced first at 100 EMA of 5121 levels. 200 EMA is at 5260 levels. On Hourly Charts too (Chart not attached) the indicators are in overbought regions so a pull back to 4970-5000 levels cant be ruled out.
Indicators - MACD Line crossed above Signal Line (Bullish), MACD Line still below zero (Bearish), Slow Stochastics still in buy mode (Bullish).


3. Derivatives
3.1 Options Data - OI
Highest Concentration of the Puts for December Series is at 4700 Strike that has 80 Lakhs in Open Interest (A Strong Support).
Highest Concentration of the Calls for December Series is at 5100 Strike that has 50 Lakhs in Open Interest (Minor Resistance Zone). If Index manages to stay above 5150 for few days then the short covering can take NIFTY to 5200-5250 levels swiftly.
In The Money Call Options Strike saw shedding of OI & In The Money Put Options saw addition of OI - Indicating the strong undercurrent to move up.
4. Sector Wise Trend
Interest Rate Sensitives Metals & Banks rallied. Consumer Durables is looking weak & every upmove its being sold into. So be careful before entering into CD sector stocks.
5. Events & News Makers 
  • Events
    • 08-Dec-2011 - Weekly Inflation numbers are due on 08th December 2011
    • 08-Dec-2011 - European Central Bank Meet - Expectations that Rates may be cut by 25bps to 1%.
    • 09-Dec-2011 - EU Summit - Further course of action probable Fiscal Union formation announcement.
  • News Makers -
    • FDI is the buzzword these days. After stiff resistance from UPA allies & opposition on allowing FDI in retail, Cash crunch Government is all set to allow FDI of upto 74% in Cable Industry. Beneficiaries in the sector can be Dish TV, Hathway Cables etc - They were all up on friday.
    • Sector to Watch Out for - Power Sector. Power Sector stocks like PFC, PTC, REC are all looking strong on charts.
  • Rumour Mill - 
    • China's PMI saw economic contraction by dipping below the 50 mark.  Chinese central bank was quick in response by reducing the reserve ratio for banks With Inflation cooling off in China, the focus of the central bank their has shifted to Growth from Inflation
    • Punters are expecting that RBI would follow China in cutting CRR (Cash Reserve Ratio) in its Mid Quarter Policy review on Dec 16th 2011 or earlier to it
    • The main reason the bankers feel is the advanced tax has to be paid by companies from Dec 15th, so there would be liquidity crunch as these corporates would withdraw money from Banks to the tune of 15K Crores. Chances of  rate cut is very likely as this week we saw the Food inflation cooling off to 8% (Four Month Low). So before going ahead with the cut in Repo & Reverse Repo. RBI may well cut the CRR (Cash Reserve Ratio - Amount of money Banks needs to keep aside as Cash & its equivalents). Street is expecting a rate cut of atleast 25bps. CRR is unchanged at 6% from May 2010. 

7. Bottom Line

  • NIFTY is expected to trade sideways with a slight positive bias (if there are no nasty surprises from Euro Zone). The action may switch to Interest Rate sensitives with a expectation of Rate/Reserve ratio cuts from RBI.
  • Expect volatility during the latter half of the week.
  • NIFTY's last calendar year low is 4675. This calendar year low so far is 4639. So it'll be a double bottom formation on the yearly charts if NIFTY doesn't move below 4639 in the remainder of the days in the year.
NIFTY Supports & Resistances - 4813 <- 4852 <- 4922 <- 5009 <- 5050 -> 5096 -> 5120 -> 5169 -> 5230