Sunday, October 30, 2011

Aban Offshore - Rectangular Pattern Break-Out

Aban offshore has broken out of a Rectangular Pattern on Friday with high volumes & looks set for a target of 500-506 levels.
Rectangular Pattern is a continuation pattern & it took 3 months for the pattern to form & a breakout was seen on friday, October 28th 2011.
8th November 2011, would be the Q2 results of ABAN. Q1 results were bad, the Company posted a net loss of Rs. 21 Crores compared to a net profit of Rs. 24 Crores (Q4 results of FY'11)


Daily Chart of Aban Offshore


CMP: 425
Target: 419+(419-332)=506.
Initial Stop Loss: Closing below 419.
Time Frame: Maximum 3 months.
Indicators: MACD has turned into buy mode. RSI is above 70 indicating strong strength in the movement.
Futures - On 28th Oct 2011, Friday the price increased 5% & with Increase in Price, there was addition in Open Interest too - Indicating built up of Longs.


Update 2011-Nov-18: On Nov 15th 2011, the stock moved below 419 & hence the pattern got invalidated & the Stop loss also got hit.
May The Trades Be On Your Side
Happy Trading / Investing. Would be glad to receive comments from all on the views expressed.
Keep a Stop Loss in each trade you Initiate.

Friday, October 28, 2011

NIFTY View - 28-Oct-2011

A Quick Update - NIFTY Weekly View
After a resolution was reached on European Debt Crisis, the European Markets all rallied by close to 4 to 5% yesterday. Dow, S&P Nasdaq closed up by 3% too. As Indian markets were closed yesterday. SGX NIFTY Closed at 5330 levels & today morning SGX NIFTY is pointing to an opening at 5420. So it'll be a gap up opening on NIFTY by roughly 175-200 Points :-). 
The look at Weekly charts of NIFTY shows that it'll approach a key resistance zone of 5420-5440 (Falling Top-Top Trendline). 
Also 200 EMA is near 5337. So the thing to watch out would be how NIFTY would move around this level & would it be able to close above it. Keep a close watch.
Be careful in initiating any fresh longs as a gap of 150-200 Points looks very unlikely to sustain.
200 D SMA is currently at 5408. So It can reach this levels Sustaining above 200D SMA would be the real strength of the Bulls as one would know 200 Day Simple Moving Average is a psychological level above which bulls will  be more powerful. 


For anyone who is still long in NIFTY one can keep a Stop Loss of 5320 as below this the Gap Filling process would start. Also if you observe the Daily Charts (Will Post Chart Later) We have made an Island Reversal Kind of Chart Pattern (This pattern would have been more valid if it was around 4700 levels than at these levels).

  • Leave alone global macro scenario even the domestic situation is not that favourable.  
  • Interest Rates at high & USD almost at 2 year high against the Rupee (The Stronger Dollar would hurt our Imports & would put a stress on our Fiscal Deficit). 
  • In the recently concluded Monetary policy review, the RBI has already lowered the growth projection for the year.
  • Inflation is still a concern with Food Inflation ruling above 10%. The base effect can kick in & bring the Inflation to around 8% by Feb-Mar. But till the Interest rates starts coming down the Capital Intensive space would be suffering by margin reduction & less order inflow.
  • This is indeed a powerful rally but the rally was all the way sold by the Domestic Institutions(Mutual Funds). Its more of a Short Covering rally than actually a rally that was fuelled by delivery based buying. But this doesn't mean we can revisit 4700 levels & move much lower. For Interim term at least the bottom of 4700 seems to be in place & we wont be going to that level unless we have another Greece like bailout situation. 
  • This is not to paint a bearish picture. As they say "Markets are always Forward Looking & they discount the future at least 6 months in earlier" - Meaning if Markets gets to know Interest rates would be coming down in 6 months from now they would start discounting that news & the favorable Interest rate sensitive sectors would start slowly to outperform the index.


NIFTY - 2 Years Weekly Chart - 1

NIFTY - 2 Years Weekly Chart - 2

                                              NIFTY - 2 Years Daily Chart 


Bottomline: Looking at the Weekly chart it looks unlikely to cross the Top-Top Trendline. So we might now enter into a sideways market again for few weeks before getting any trending moves like we got in this October.
May The Trades Be On Your Side
Happy Trading / Investing. Would be glad to receive comments from all on the views expressed.
Keep a Stop Loss in each trade you Initiate.

Monday, October 24, 2011

Breakout Candidates - 25-Oct-2011

Hindustan Unilever
Hindustan Unilever - 11-Oct-2011 - In this corresponding post I had identified a pattern that might occur if 320 on closing basis was broken. But as they say markets are supreme & patterns can get invalidated. The pattern did not become active as the stock price dint close below 320 in these 10 days (8 odd trading sessions). 
On Friday it bounced off a key support levels (Demand Zone). Today it broke out above the Resistance trendline & is ripe for a fresh move of 5% atleast & if the overall scenario remains good can move much higher. Also today its close competitor ITC came out with good numbers (Especially the FMCG segment delivering good gains on growth in margins).

HIndustan Unilever - 2 Year Daily Charts

Trading Strategy: Can Initiate Long positions around current levels or if it dips to 337-335 levels keeping an Initial Stop Loss levels of 330 levels for targets of 345-350 & higher if markets remain conducive. 
HLL is one of the Low Beta counter & hence any fierce rally in NIFTY may not translate in fierce rally in HLL & vice-versa.

Bajaj Auto
It's third time lucky for Bajaj Auto, after 2 unsuccessful attempt to breach 1650 levels, Bajaj Auto has managed to close above it today. 


Trading Strategy: Can Initiate Long positions on dips around 1670 levels with Initial Stop loss being  1650 for Medium to Long term targets of 1800+ Levels (Should be above 1650 levels). In short term still has strength to move up by another 5 percent if things remain conducive.
It would be prudent to take positions post RBI Meet morrow or to be even more safer on Friday.


13-Nov-2011 An Update: Both the Stocks rallied well. Infact HLL made a 10 Year high by closing above 370 levels. It's currently holding well at price of 395. Bajaj Auto to moved swiftly to 1820 levels & currently is consolidating around 1700-1750 levels.

May The Trades Be On Your Side

Sunday, October 23, 2011

Nifty Weekly View - 23-Oct-2011


Happy Deepawali to all of you 

As we enter the Diwali Week, We have lot of events that would unfold in the next few days. Tuesday - RBI Meet, F&O Expiry. Wednesday - Muhurat Trading on the occasion of Laxmi Puja (An hour of trading in the evening from 4.30 PM to 6.00 PM), Thursday - Closed on occasion of Diwali. Wednesday also we have outcome of the EFSF meeting from the Euro Zone. So it's an action packed week.
Taking the events one by one. 
RBI Meet - Expectations are a rise in Interest rates (Repo Rates & Reverse Repo Rates) of probably 25bps or 50bps. 
Impact to the Markets - Rise of interest rates may make Index to move lower. If the rates are kept unchanged then it can be pleasant Diwali Gift to the markets & can rally.
F&O Expiry - October Expiry Month, i.e, From 30-Sep-2011 to till date NIFTY is up a meagre 35 Points. But it was a See-Saw move, NIFTY made a low of 4728 on 4-Oct-2011 & an High of 5160 on 17-Oct-2011. This being a truncated month with just 17 Trading Sessions & Expiry is happening 2 days before the last Thursday of the month on Tuesday due to Diwali.
OI Data suggests that Highest OI in CE's are at 5200 Calls & Highest OI in Puts are at 4800PE. So it's unlikely NIFTY moving beyond 5200 this expiry month nor move below 4800. NIFTY might expire somewhere between 5000-5100 levels.
EFSF meeting - There is a positive buzz surrounding it that there wont be any hurdles in funding for the crisis. With such expectations European Indices on Friday closed with comfortable gains of close to 1.5% and above. Even a small bit of disappointment in the outcome can create a panic in their markets & eventually this would spread to other markets as well.
NIFTY - Coming to our own NIFTY & its charts. The charts doesn't seem positive, courtesy the last hour selling we saw on Friday. NIFTY was rebounding well of the 50EMA (5070), once that broke there was a free fall of close to 40 odd points in less than 15 minutes. This was post L&T Q2 results, which were actually good but their guidance was way too low at 5% (which the markets were not expecting) & hence this counter saw heavy selling.

NIFTY Daily 3 Months Chart


From 05-Oct-2011 NIFTY started bouncing from a strong support levels of 4720-4700. Gained 400 odd points in 10 sessions. Last week it has lost roughly 100 points.
Its taking support at the upward sloping trendline but facing resistance at the Top-Top trendline. It got resisted from the same line on Wednesday & Friday too.

CMP: 5050
Supports: 5050, 4965, 4900
Resistances: 5110, 5160-80 zone, 5230-5320 (Gap Area)
50EMA: 5070, 20EMA: 5026
Indicators: MACD - Has just gone below the Signal line indicating the weakness.
RSI - Pointing southwards but holding on to 50 would be a positive sign for Bulls.
EMA: NIFTY has moved below 5EMA & 50 EMA (Bearish Sign), Took support just above the 20EMA. So going forward 50EMA will be the zone that would act as a strong resistance.

Bottomline: The week ahead looks to be a week that would be in favour of Bears more than the Bulls (atleast the Charts are pointing towards that). Keep a close tab on the news as that would be significant in opening up the Market Direction.
Trading Strategy: One can go Long in NIFTY, once the Top-Top trendline is broken on the upside & NIFTY moves above 50EMA. Stop loss being the Trendline itself.
One can Short once NIFTY breaks the Upward Sloping trendline & gets confirmation of it moving below 20EMA. Stop Loss being the 50EMA.

May The Trades Be On Your Side

Happy Trading / Investing. Would be glad to receive comments from all on the views expressed.
Keep a Stop Loss in each trade you Initiate.

Thursday, October 20, 2011

Hindalco - 20-Oct-2011

Hindalco - Hanging on to the Cliff

Hindalco is not looking good on the charts. From here if 120 levels is broken, Chart suggests a fall to the magnitude of 20-25% price damage. On Monthly charts its precariously hanging on to the 120 levels. Below which its a clear shorting candidate.

Hindalco - Monthly Chart

Mind you it's a Monthly chart so it might take time to achieve the target. Follow the levels carefully. 


Trading Strategy:
Hindalco is currently at a key support level of 120. Any breach of it will cause significant damage to it's chart.
Short only after the Daily period Candlestick below 120. Initial Stop Loss level being 124 levels & once trade becomes profitable, Keep trailing the Stop Loss.
If Hindalco indeed bounces of the 61.8% retracement levels, then wait for it to reach 50% retracement levels (Around 145-150) levels & one can go short there.


May the Trade be on your side.
Happy Trading / Investing. Would be glad to receive comments from all on the views expressed.

Wednesday, October 19, 2011

Hero Motors - 11-Oct-2011

An Update:
Hero Moto Corp - 1 Year Daily Chart


19-Oct-2011 Update: Much awaited Bounce in Hero Moto Corp has come the day after the results & it closed 4% up from the previous close. From the charts its still got steam to move further but as NIFTY is at crucial resistance & RBI meet round the corner its safe to take the profits. Hence from me the Trading Idea is closed with roughly 7 to 8% profit in a week :-) 

Post of 11th October 2011 is as below:
Hero Motors - Correction Over?

Hero Motors (erstwhile Hero Honda), has had a good run up till 2200 levels & corrected approximately 12% from the top. Now after correction & a brief consolidation. Its ready to resume towards its uptrend. 
Stock has taken support at 38.2% Retracement levels of 1905-1910 (The move from 1375 to 2237)

Hero Motors - 1 Year Daily Chart


Hero Motors - 1 Year Daily Chart - Fibonacci Retracement Levels


Immediate resistance is at 50 D SMA = 1997. One can buy above 1997-2000 levels and keep holding it, till its above 50 D SMA. Stock would become stronger once it crosses its 20 D SMA (Currently it's at 2054, but falling at a brisk pace).

Indicators: 
MACD is about to turn into Buy Mode (Once the crossover happens)
Slow Stochastics is in buy mode.
RSI is at 44 levels & pointing upwards.

Bottom Line: Keep a close watch on this stock as it's low beta stock & can give steady returns for both Traders & Investors.

Market Snippets: Stock is considered to be in Strong Uptrend when the Price is above the moving averages. And the shorter term moving averages are above than longer term moving averages.

*SMA - Simple Moving Average

Sunday, October 16, 2011

NIFTY View - 17-Oct-2011

NIFTY View - 17-Oct-2011 - Be Careful With the Longs

An update on the post W Formation on the Cards. After the beside post NIFTY has rallied close to 450 points & now is at crucial resistance. Reliance Q2 results has come & hasn't been that great (Poor GRMs even with weaker rupee & Operating profit lesser than last year if other income is excluded). So it wont be pulling the market away like it did last week. 
TCS & HDFC Bank's result is due tomorrow & if TCS indeed provides good results then there may be positive movements in the Large & Mid-cap IT Stocks like HCL Tech, Wipro, Patni, Polaris etc.

Now a close look at Hourly chart of NIFTY shows us that we are moving in a rising trend channel of roughly 100 points in width. So any move out of the channel would mean a swift 100 point move. Also need to remember over the past 8-9 weeks we are in the range of 4700-5170 (A rough 470 point range).

NIFTY - Hourly Charts


Interesting thing to note apart from the Movement of NIFTY in the trend channel is the Indicators. MACD has gone below the signal line & A small divergence is seen in RSI & ROC (Not making new highs).
Trading Strategy: Be careful with the longs. Keep a close watch on the levels of 5170 & also on the Trend channel break-out & break-down & initiate trade accordingly.
Support 1 is at 5040 levels & Support 2 at 4960 levels.

It's still a buy on declines. So an Long entry can be made at the support levels.

Friday, October 14, 2011

India VIX - 14-Oct-2011

INDIA VIX - Negative Correlation With NIFTY

India VIX is a volatility index based on the NIFTY Index Option prices. From the best bid-ask prices of NIFTY Options contracts, a volatility figure - annual percentage (%) is calculated which indicates the expected market volatility over the next 30 calendar days. VIX value represents the Investors perception of market volatility in the near term.

For those keen on actual computation of VIX & its methodologies can read this White Paper published on NSE - White Paper on VIX

Higher the VIX Values Higher is the Expected Volatility & hence Higher would the premium be on Options Strikes (Calls / Puts).

Usually its seen that NIFTY rises when VIX falls & NIFTY falls when VIX Rises. India VIX was introduced from 2009 March.

INDIA VIX - 2 Year Daily Chart


VIX moves in a channel most of the times as, if economy is doing well Volatility would be low & hence Index would be slowly inching upwards & VIX would be in a tight consolidating range. There are very few instances (atleast from the day when VIX has been published that it has stayed above 40. During global turmoil VIX shoots up.

From the Chart its clear that VIX has shot up from levels of 16% in June'11 to close to 37% in Oct'11. Post that there has been a significant correction in VIX & it has fallen 25% from the peak of 37-38%.

It's in a trading range of 25-35. As per charts, a bounce can be expected from 25 levels (Channel Support) & may consolidate for few weeks near 25-30 before gaining strength to move up. If 25 is broken then its next support comes around 23. Once 25 is breached it will enter into the channel zone of 15-25.

Indicators: VIX has fallen below its 50 Day SMA. 200 D SMA is near 23 & inching up. MACD is in sell mode & RSI even after having multiple supports at 50 levels has gone to 45 & heading southwards. Indicating VIX can move still down.

Bottom Line: What it Implies for NIFTY? VIX nearing support indicates NIFTY also moving towards its crucial resistance levels of 5160-5180. If VIX bounces then it can be assumed that NIFTY is topping out for short term at around 5250 levels. If VIX indeed breaks the support of 25 and is headed lower, then it can mean that NIFTY has more headroom & can move to 5350-5400 levels.

Keep a close tab on VIX as it can also be a good indicator of how Index would move further. 
Would be adding more to this post on Superimposed Charts of Both NIFTY & VIX.
Let me know how you liked this article & would you be interested in reading more on the same lines.

*SMA - Simple Moving Average

Wednesday, October 12, 2011

Reliance - 12-Oct-2011

Reliance at Crucial Resistance
Reliance Industries over past couple of years has been traders delight (by moving in a parallel trend channel). Now it's near the upper end of the channel(850 levels). If breaks this it can move to 900 swiftly & there by pushing the index too above 5200-5250. 

Reliance has 8.5% weight-age in NIFTY & 9.8% weight-age in SENSEX. The weight-ages keeps varying daily depending on the market cap. Lynch pin's move would go a long way in deciding where the Index moves.

Reliance Industries - 3 Years Weekly Chart


On Weekly Chart The Stock is knocking on the doors of 850 levels. A breach would bring in a fresh level of buying coming in. Also on Monthly Charts over past 3 months the stock is forming higher lows on each of the 3 monthly candles & looks unlikely to be breaching it. As the stock has come off a period of far underperformance.

In the near term the OI Data suggests that ITM Option writers are unwinding (Bullish for stock to move up). This is happening from last friday evening, continued today too.

Indicators: RSI is still below 50. A move above 50 would indicate strong uptrend would follow. Till then it can be considered as a corrective upmove.
MACD - Signal line is about to cross the Smoothner (Exponential Moving Average line). MACD is still below 0. 

Bottom Line: Stock will be positive only on weekly close above 850 levels & if it can sustain that level. Then NIFTY too wont be making any new lows soon. Atleast for this stock worst seems over as long as its above its previous low of 720-730 levels.

Happy Trading / Investing. Would be glad to receive comments from all on the views expressed.

Tuesday, October 11, 2011

Chambal Fertilizers - 11-Oct-2011

Chambal Fertlizers - Respects 61% Retracement Levels

Chambal - 05-Oct-2011 - As per the beside posted link on 05-Oct-2011, charts had pointed that a short term bounce was due around 88-89 levels. Just a week later we have had 7.8% move on the stock accompanied by huge volumes. Next resistance it would face is around 50EMA of 101.  


Long Term Investors can accumulate it around 78-80 levels with a Stop Loss of 75.

Happy Trading / Investing. Would be glad to receive comments from all on the views expressed.

Hindustan Unilever - 11-Oct-2011

Hindustan Unilever - Ripe for a Short Term Correction?

Hindustan Unilver, is a Defensive & a Low Beta stock. In past four months when Index has done nothing this stock has moved up by 30% from 260 to 340 levels. Now its in a correction mode & has formed a Rising Wedge Pattern (Bearish - Reversal Pattern). Stock is in Primary Uptrend & undergoing correction in intermediate trends.

Hindustan Unilver - 3 Year Daily Chart

A fall below Upward Sloping Trendline would confirm this Bearish - Rising Wedge Pattern & would move the stock down. One can short this stock below 320 levels keeping a Stop Loss of close above 320. Target for this pattern is the width of the channel. Stock can come down to 310-300 levels. 

Hindustan Unilver - 3 Year Daily Chart - Fibonacci Retracement Levels


In a panic market, If it comes to 280-260 levels (280 is also 50% retracement level of the entire rise from 220 to 340). It'll be excellent levels to add for Long Term.

Indicators:
MACD is in sell mode.
RSI is below 50 & making lower tops & lower bottoms.

Bottom Line: Bearish in Short to Medium Term. But Bullish in Long Term. Long Term Investors can accumulate it around 300-310 levels & add more around 280 levels.

Market Wisdom: When Markets are bearish & are in a tight consolidating range or in a bearish mode. It's the Defensives that outperform.

31-Oct-2011 An Update: The pattern dint even get activated as the Stock did not close below 320 levels.
Happy Trading / Investing. Would be glad to receive comments from all on the views expressed.

Monday, October 10, 2011

Infosys - 10-Oct-2011

Infosys Results Time - Will This Time Be Any Different?

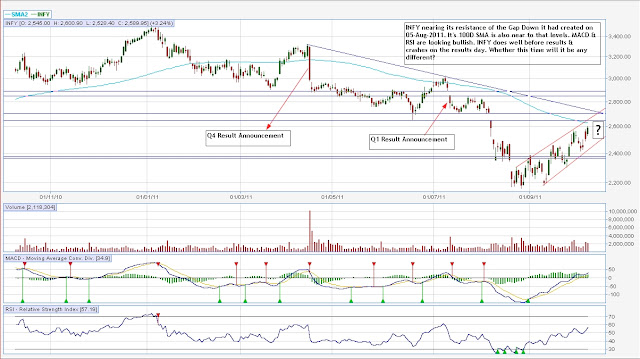
Infosys the Bell-weather of the IT has made it a habit of rallying till the penultimate day of the Results & falls on the Result day (Falls are to the magnitude of atleast 3% or more). Will the history repeat itself or will it be different this time? Results are due on Wednesday, Oct 12th 2011. Today It made a strong case with returns of 3%.

Infosys - 1 Year Daily Chart


The stock seems to be in an Short Term Uptrend. It's moving in a upward sloping Trend Channel. Break of the trend channel would lead to a fierce rally. But the channel looks unlikely to be broken in the run up to the Result Day.


Fundamentally: All eyes would be on Infosys' guidance for the Second half of the financial year & how much has the Dollar appreciation boosted their current margins. 
MOSL has come up with their estimates on the IT Bell-weather. According to the research firm, Infosys September quarter net revenue is expected to go up by 6% at Rs 7934 crore, quarter-on-quarter, QoQ basis. The company's net profit is expected to go up by 7% at Rs 1842.1 crore on QoQ basis.

Technically: Price is above its 50 D EMA & SMA. 100 SMA is near 2625 levels. Resistance would be around the Unfilled Gap of 2704-2643 levels. Above this the next resistance comes around the levels of another Unfilled gap 2888-2850.
2800 is also the level of 50% retracement of the fall from 3500 to 2161 levels.

Indicators: RSI is above 50 indicating strength in the current movement & MACD has moved to positive territory with a Buy Mode.

Bottom Line: Stock looks to be in a buy mode. Would be interesting to note how it would negotiate the Gaps. It's movement will go a long way in directing NIFTY's march too.

Market Wisdom: If Price is above the Gap, the Gap would act as Support. Conversely if Price is below the Gap, the Gap would act as Resistance.

*SMA - Simple Moving Average
Happy Trading / Investing. Would be glad to receive comments from all on the views expressed.

Saturday, October 8, 2011

Dollar Index View - 07-Oct-2011

Dollar Index & It's Negative Correlation (Inverse Relationship) to Indian Markets 

Foreign funds influence our Equity Index movements in a big way. That is if they start investing then the stocks move up & if they start pulling out money the stocks keep going down. 

This movement can be tracked effectively by keeping a close tab on US Dollar Index.

US Dollar Index is an Index of value of United States Dollar (USD) relative to basket of currencies. The Basket of Currencies and there weightages are shown in the below chart.


EUR: Euro, JPY: Japanese Yen, GBP: Great Britain Pound, CAD: Canadian Dollar, SEK: Sweeden Krona,  CHF: Switzerland Franc

Dollar Index gains or falls when USD appreciates/depreciates against these basket of currencies respectively.
In the recent past a lot is happening in the Euro Zone related to high probability of Greece defaulting on its Bonds, also situation is looking grim for other European Union nations of Spain, Italy, Ireland, Portugal & Belgium. During such times a flight for safety is happening and there is a fresh demand for USD as a Safe haven, although inherently US itself is in a double dip recession scenario. 

What it means for us? In Dollar Index Euro has highest weightage of 58.6% so any more problems in Euro zone would weaken Euro, thereby strengthening USD. If USD strengthens, Dollar Index would appreciate. 
Dollar Index having inverse relationship with Indian Equities would mean Equities falling more with Dollar Index rising & vice-versa.

3 Year Dollar Index Weekly Chart


The chart is self explanatory. In March'09 Indian indices & majority of large-cap, mid-cap, small-cap stocks bottomed out & ventured into a fresh round of upward journey. During that time the Dollar Index was at its peak around 89. 

After a steady consolidation around 72-75 for four months from Apr'11-Aug'11. DXY (Dollar Index) has broken out & in a fierce rally has managed to close above its 50 Week EMA & now knocking on the doors of 200 Week EMA. A cross above 200 Week EMA would make it more stronger. Immediate resistance would be faced at 200 Week EMA & next resistance at its previous peak of 81.44.

Indicators:
MACD: Still in Buy Mode with Strength increasing.
RSI: Above 60 & moving up, Indicating the strength in the ongoing rally.
ROC: Positive and around 4%, indicating the Momentum is still strong in the move.
A close above 79 levels and a rally towards 81 would mean Indian Index (NIFTY) would breach 4700 on the downside & move lower. Keeping a close watch on this would give a better view of the times ahead & how Index would move.


Bottom Line: Looking at the Price, Indicators, Moving Averages & the situation in the Euro Zone - Probability of Dollar Index  going up is higher than correcting from here.

Market Wisdom: A security is said to be in an Uptrend, if the price is above its 50 Period Moving Average & which in turn would be above its 200 Period Moving Average. 
A security is said to be in an Downtrend, if the price is below its 50 Period Moving Average & which in turn would be below its 200 Period Moving Average.

*EMA - Exponential Moving Average

Happy Trading / Investing. Would be glad to receive comments from all on the views expressed.

Thursday, October 6, 2011

NIFTY View - 05-Oct-2011

NIFTY - A "W" Formation on the cards?
  • Has taken support at 4720 levels couple of times. 
  • Positive Divergence seen in RSI. 
  • W - Formation on the charts?. If 4720 holds on closing basis, can move to 5100-5200 levels.
  • Immediate Resistance for NIFTY is around 4879-4934 (Gap Created by a Gap Down opening on 03-Oct-2011. Once NIFTY closes above 4934 on closing basis and as long as it is above 4879 can attempt to reach the next gap area of 5060-5110 created again by a Gap down opening on 21-Sep-2011. Above this closing the next resistance & the major resistance remain the recent double top around 5168. 

So by this, if 4720 has to be taken out most likely it'll be by a Gap-Down? Lets keep a open mind & take positions accordingly. Short below 4700 for a free fall of 3-5%. Above till remain cautious without an bias.

NIFTY 6 Months Daily Charts


Bottom Line: NIFTY is forming lower highs & in a consolidating range. Global scenario points to NIFTY might move lower & break its key support of 4700. But till that level holds there is no need to be bearish.


Market Wisdom: Through past observation one can notice when key Support or Resistances have to be breached, More often than not they are breached by either Gap-Down or Gap-Up respectively. 


Happy Trading / Investing. Would be glad to receive comments from all on the views expressed.

Wednesday, October 5, 2011

Arvind - 05-Oct-2011

Arvind Mills - A Stutter Before the Next Move
Arvind Mills after a good run up is facing resistance around 100-102 levels & on wednesday there was a sell-off to the magnitude of 5%.


Arvind Ltd - 1 Year Daily Chart


A view at the chart would show you how steep the climb was & by doing so it has formed a Rising Wedge sort of pattern. As it has broken down of the steep trendline the targets for it now would be around 85-80 levels. This would get invalidated with a move above 102 levels on closing basis.
The stock is still in an uptrend & shorting if done should be done with utmost care & strict stop-loss levels.
Indicators:
MACD has just turned bearish.
RSI started to come down from the levels of 85.


Fundamentally with Dollar strengthening against the Rupee, would work well for Export oriented companies & their revenues & profits might show a big jump. 


Bottom Line: Seeing the Candlestick pattern & multiple resistances around 100-102 levels. The stock is most likely to come down to levels of 85.


Market Wisdom: A stock that has rallied a lot, usually takes a breather before making its next move.


Happy Trading / Investing. Would be glad to receive comments from all on the views expressed.

Chambal Fertilizers - 05-Oct-2011

Chambal Fertilizers - Fallen Off The Cliff 

When broader markets have corrected by more than 20%, Chambal has outperformed by rallying 60% in past 3 months. From levels of 70 in June'11 to around 118 in September. Fundamental reason for the rally being the news of Urea De-control by the government. As the news came out that decontrol process may be delayed. The traders started moving out of the stock & it has started correcting from 115 levels to current levels of 90.

88-90 is an important zone for Chambal, where there has been multiple resistances at the past, now these would act as support. Also 89 levels are 61.8% retracement levels from the   top of 118. if 88-89 is breached on closing basis then it can head to its important & much stronger channel support of 79-80 (See in next chart).


Chambal Fertilizers - 6 Months Daily Chart


The below Chart is a long term Chart (5 Years) of Chambal Fertilizers. Its moving in a Upward Trend Channel (Trend Channel range of 40). As per this chart 79-80 is a crucial support for Chambal. 

Chambal Fertilizers - 5 Years Daily Chart


79-80 can become a good entry point to even Long Term Investors. Urea Decontrol may decide the next move of the stock.
Keep a strict stop loss of around 75 for any long term investments that would be initiated at around 78-80 levels.

Market Wisdom: If a stock is in strong uptrend more often than not it bounces from this long term trend lines.


Happy Trading / Investing. Would be glad to receive comments from all on the views expressed.